By Tim Anderson
In 2014, year-over-year unemployment rates fell in all 50 states. That hadn’t happened since 1984, and the news was greeted as another positive sign of economic recovery. But there is another trend getting more attention from economists and state policymakers: the continuing decline in rates of labor participation.
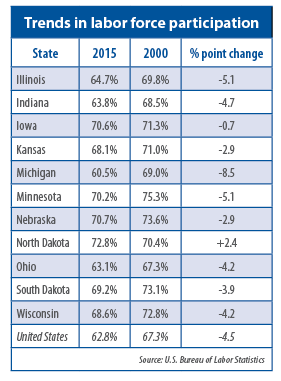
Close to six years after the official end of the Great Recession, these rates continue to fall. The labor force includes people who have jobs and those who are actively seeking work (the unemployed). Four states in the Midwest (North Dakota, Nebraska, Iowa and Minnesota) have the highest labor-participation rates in the country. But with the exception of North Dakota, every state in this region has been following the national trend: declines in participation since 2000 (see table).
For state policymakers, the causes for this drop can serve as an indicator of a state’s economic health — for example, more people are long-term unemployed, become discouraged about finding work and drop out of the labor market. That has contributed to the decline in participation rates, but there are other factors as well, notes Eugene Steuerle, a fellow at the Urban Institute.
People are retiring earlier and living longer, he says, and state populations are aging. More people, too, simply aren’t entering the labor force, and are instead staying in school longer or raising children, a 2013 Urban Institute study notes.
And while labor-participation rates fall, the number of people on federal disability rolls is on the rise — a 77.3 percent increase between 2000 and 2013. In comparison, the U.S. population has increased by 12.0 percent over that time.
Earlier this year, Express Employment Professionals (a provider of staffing for businesses) released a report examining state-by-state increases in the number of people on federal disability. Between 2008 and 2013, two Midwestern states had the largest increases in the nation: Michigan (29.1 percent) and Ohio (28.2 percent). North Dakota had the Midwest’s lowest rate of increase, 12.8 percent (fifth-lowest among the 50 states.)